
 @gwsbhqt
dsh-insight
洞察 — read-only insight panel for a DeepSeek Harness profile: where every plugin, service, tool and model came from, which config layer inserted or disabled it, and what is running right now.
- Stars
- 3
- Language
- TypeScript
- Created
- Aug 25, 2026
- Updated
- Sep 26, 2026
Introduction
洞察 · dsh-insight
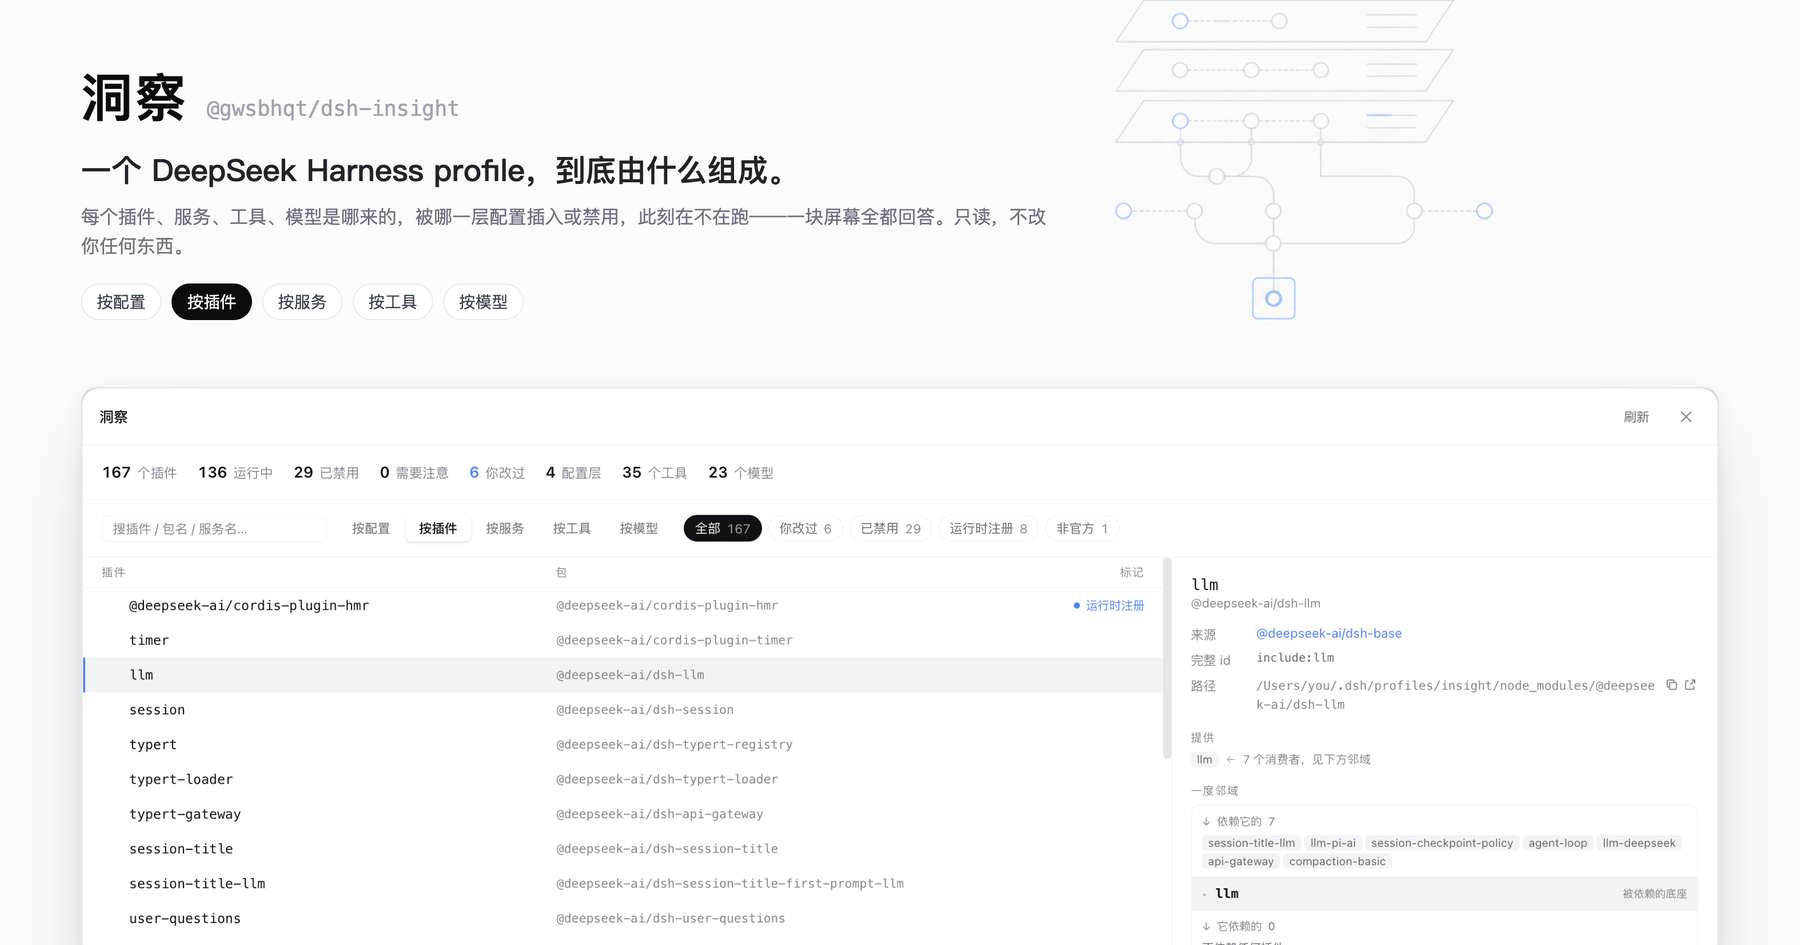
One screen that answers what a DeepSeek Harness profile is actually made of.
Every plugin, service, tool and model — where it came from, which config layer inserted or disabled it, and whether it is running right now. Read-only.




Install · The five axes · Why it refuses to guess · Read-only by design · 简体中文
Install
dsh plugin --profile web add @gwsbhqt/dsh-insight
Update:
dsh plugin --profile web update @gwsbhqt/dsh-insight@latest
Then open Settings → 洞察 / Insight. No build step, no restart. The panel ships both halves: a host plugin that collects the data and a browser plugin that draws it.
The problem
A running dsh profile is assembled from layers you never see side by side:
- each bundle's own
cordis.patch.yml(@deepseek-ai/dsh-base, market packages, your own plugins) - your profile's patch layer,
$DSH_HOME/profiles/<name>/cordis.patch.yml $DSH_HOME/settings.yaml— legacy settings file from older dsh; 0.1.7 imports it once on first start and renames it tosettings.yaml.imported, so it is listed only when present$DSH_HOME/.credentials.yamland environment variables
Which of it survives is decided by patch semantics (insert / update / disable, by id) and by what the cordis loader actually managed to start. No single file tells you the answer, so "why isn't this plugin running" and "where did this model come from" turn into a hunt across four files and a runtime you cannot see.
洞察 does that derivation for you, live, and shows its work.
The six axes
One dataset, six ways to sort it. The first five are causal: config produces plugins, plugins provide services, services register tools and models. By preset comes last — it is not about what already runs in this process but about a second configuration: the agent-plane one, mounted only when a session starts. Switching axes never clears your selection.
按配置 · By config — which layer wins
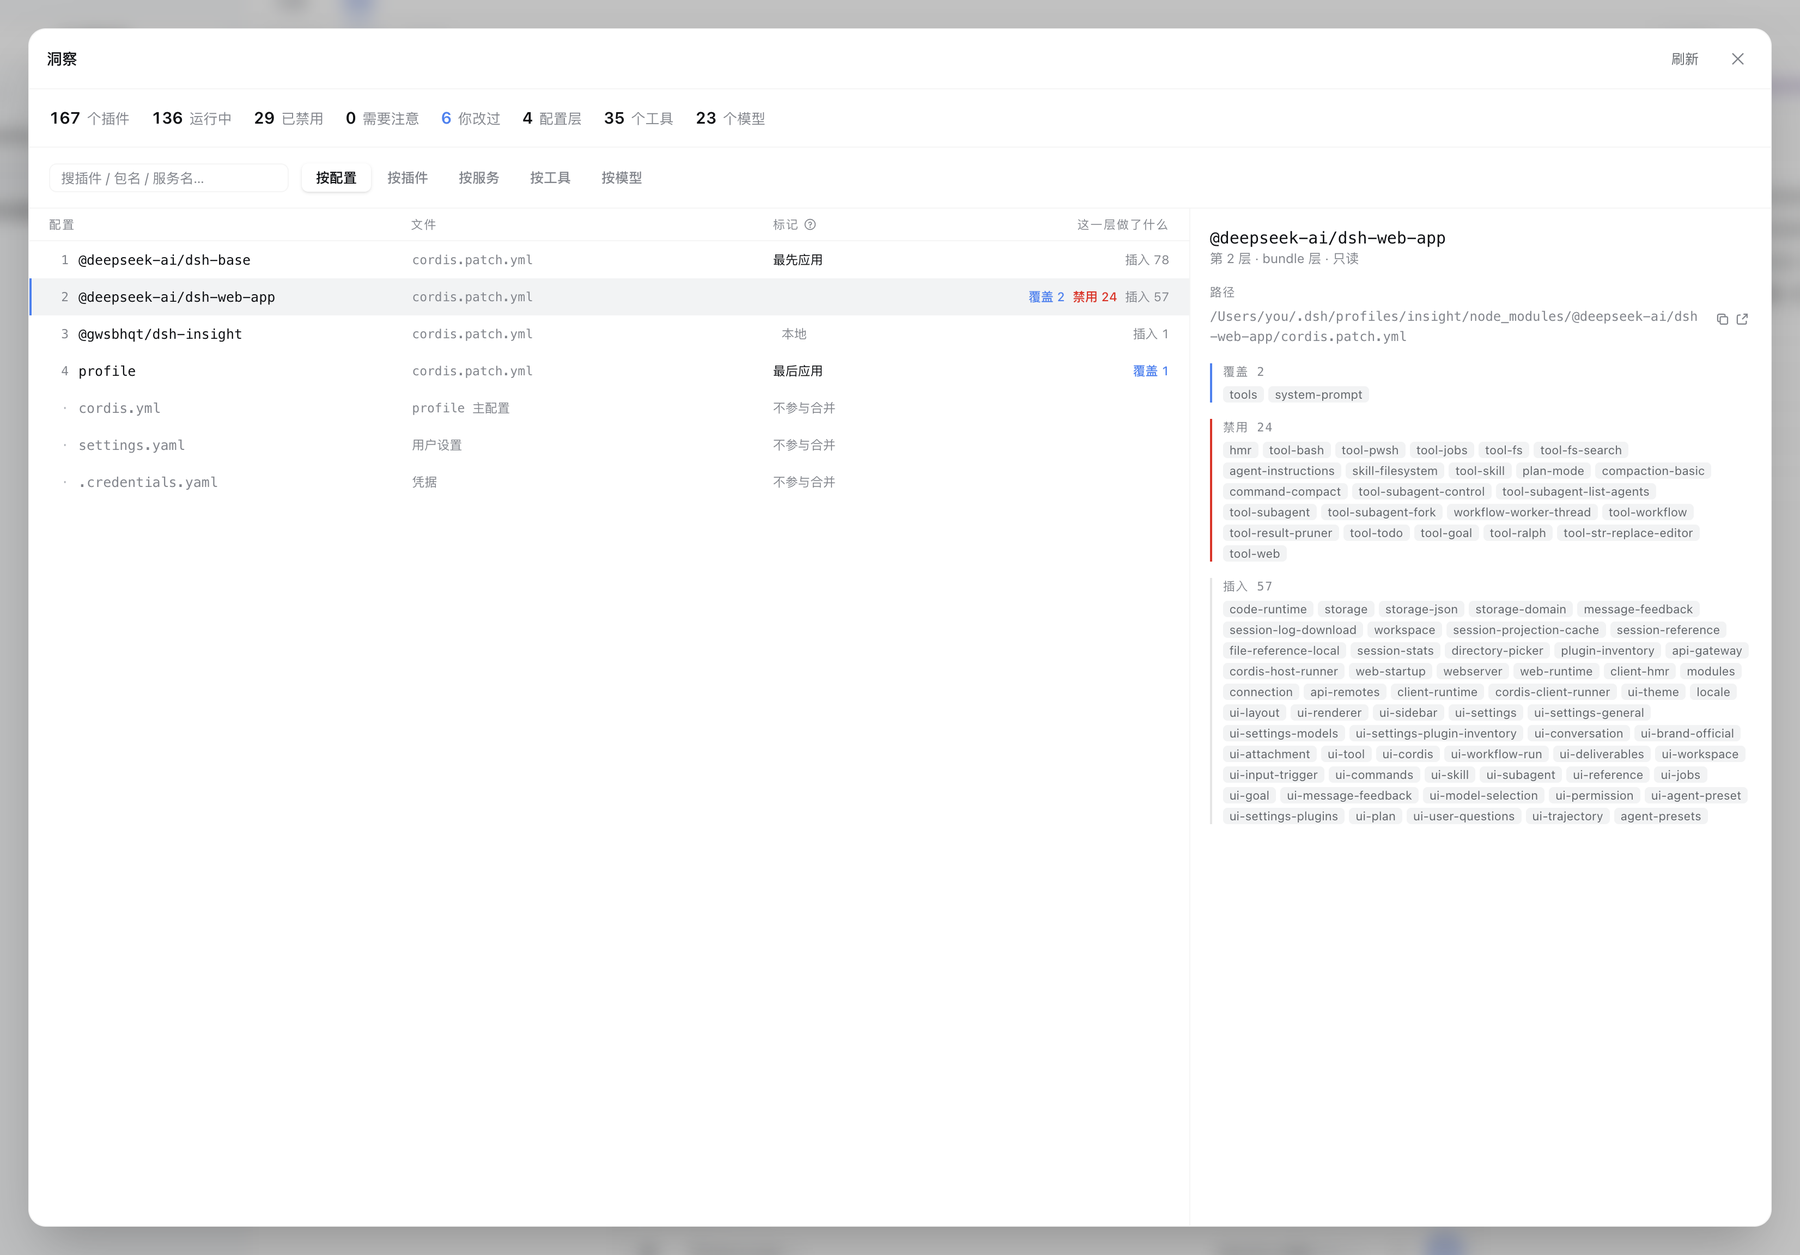
Every config layer in application order, with what it did to the tree — inserted 78, overrode 2, disabled 24. The first and last layers are marked, because a number alone never says which direction wins. Config files that take no part in the merge (the profile's cordis.yml, settings.yaml, .credentials.yaml) are listed in the same table, marked as such — you usually want them for their paths.
Pick a layer and the right pane names every entry it touched, each one a link into the plugin axis.
按插件 · By plugin — the dossier
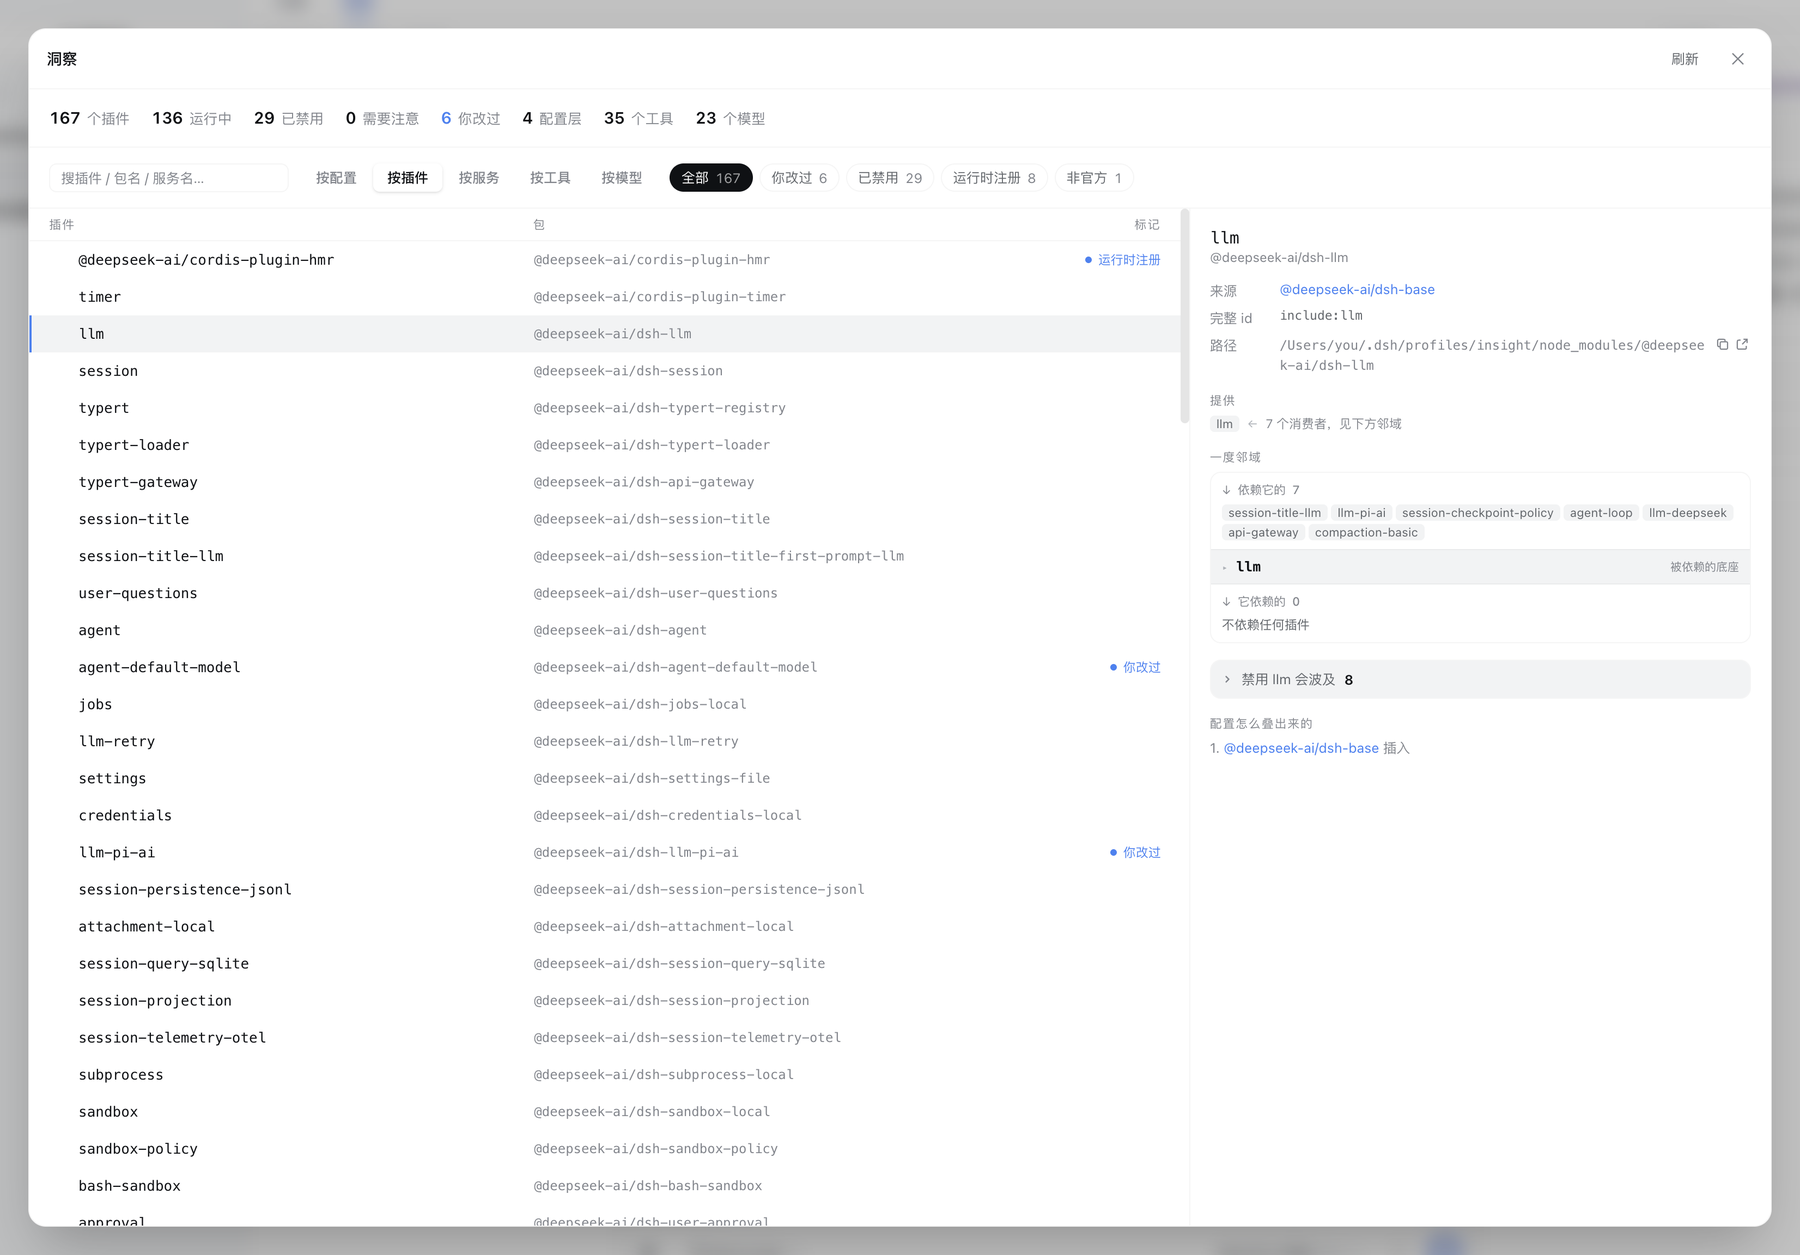
The live loader tree — containers, nested realms, disabled entries folded away at the end of the level they belong to. Select one and get its whole dossier:
- Where it came from — the layer that inserted it, its full entry id, its package and path on disk
- Wiring — services it provides and consumes, each with its counterpart; built-in host services are named as such instead of showing up as a missing provider
- Blast radius — who depends on it, transitively, so "what breaks if I turn this off" is a number and a list rather than a guess
- Its settings — effective value, plugin default, and your override, side by side
- How the config stacked up — the ordered list of layers that touched this entry, and what each one did
Filter chips narrow the same list: needs attention, you changed it, disabled, runtime-registered, not official.
按服务 · By service — what actually connects plugins
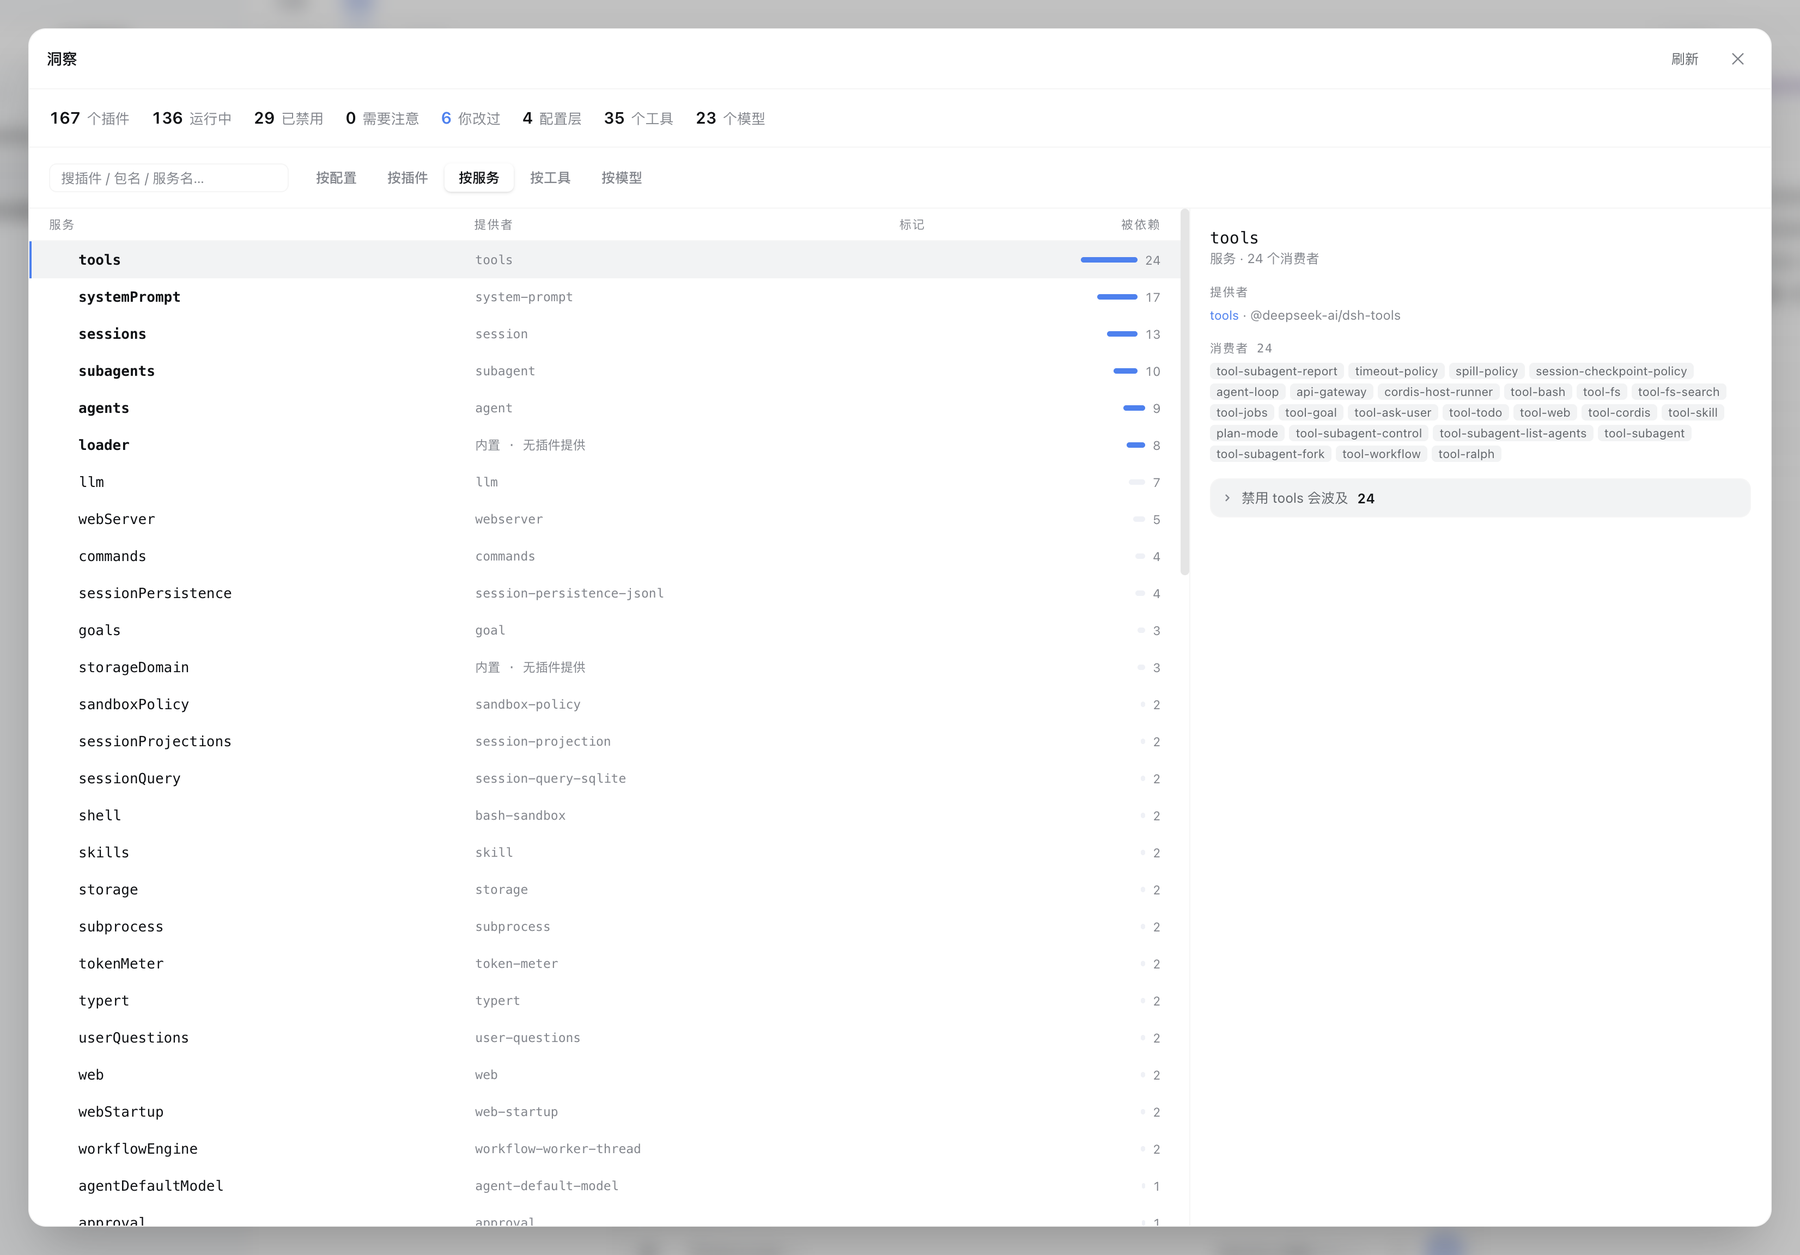
Services are the real edges between plugins, so they get their own axis: who provides each one, how many consume it, and — for a hub — the full impact list. This is a table and not a canvas on purpose: the dependency graph of a real profile is star-shaped, and a hub's edges cross the whole canvas no matter which layout you pick.
按工具 · By tool — what the agent can actually call
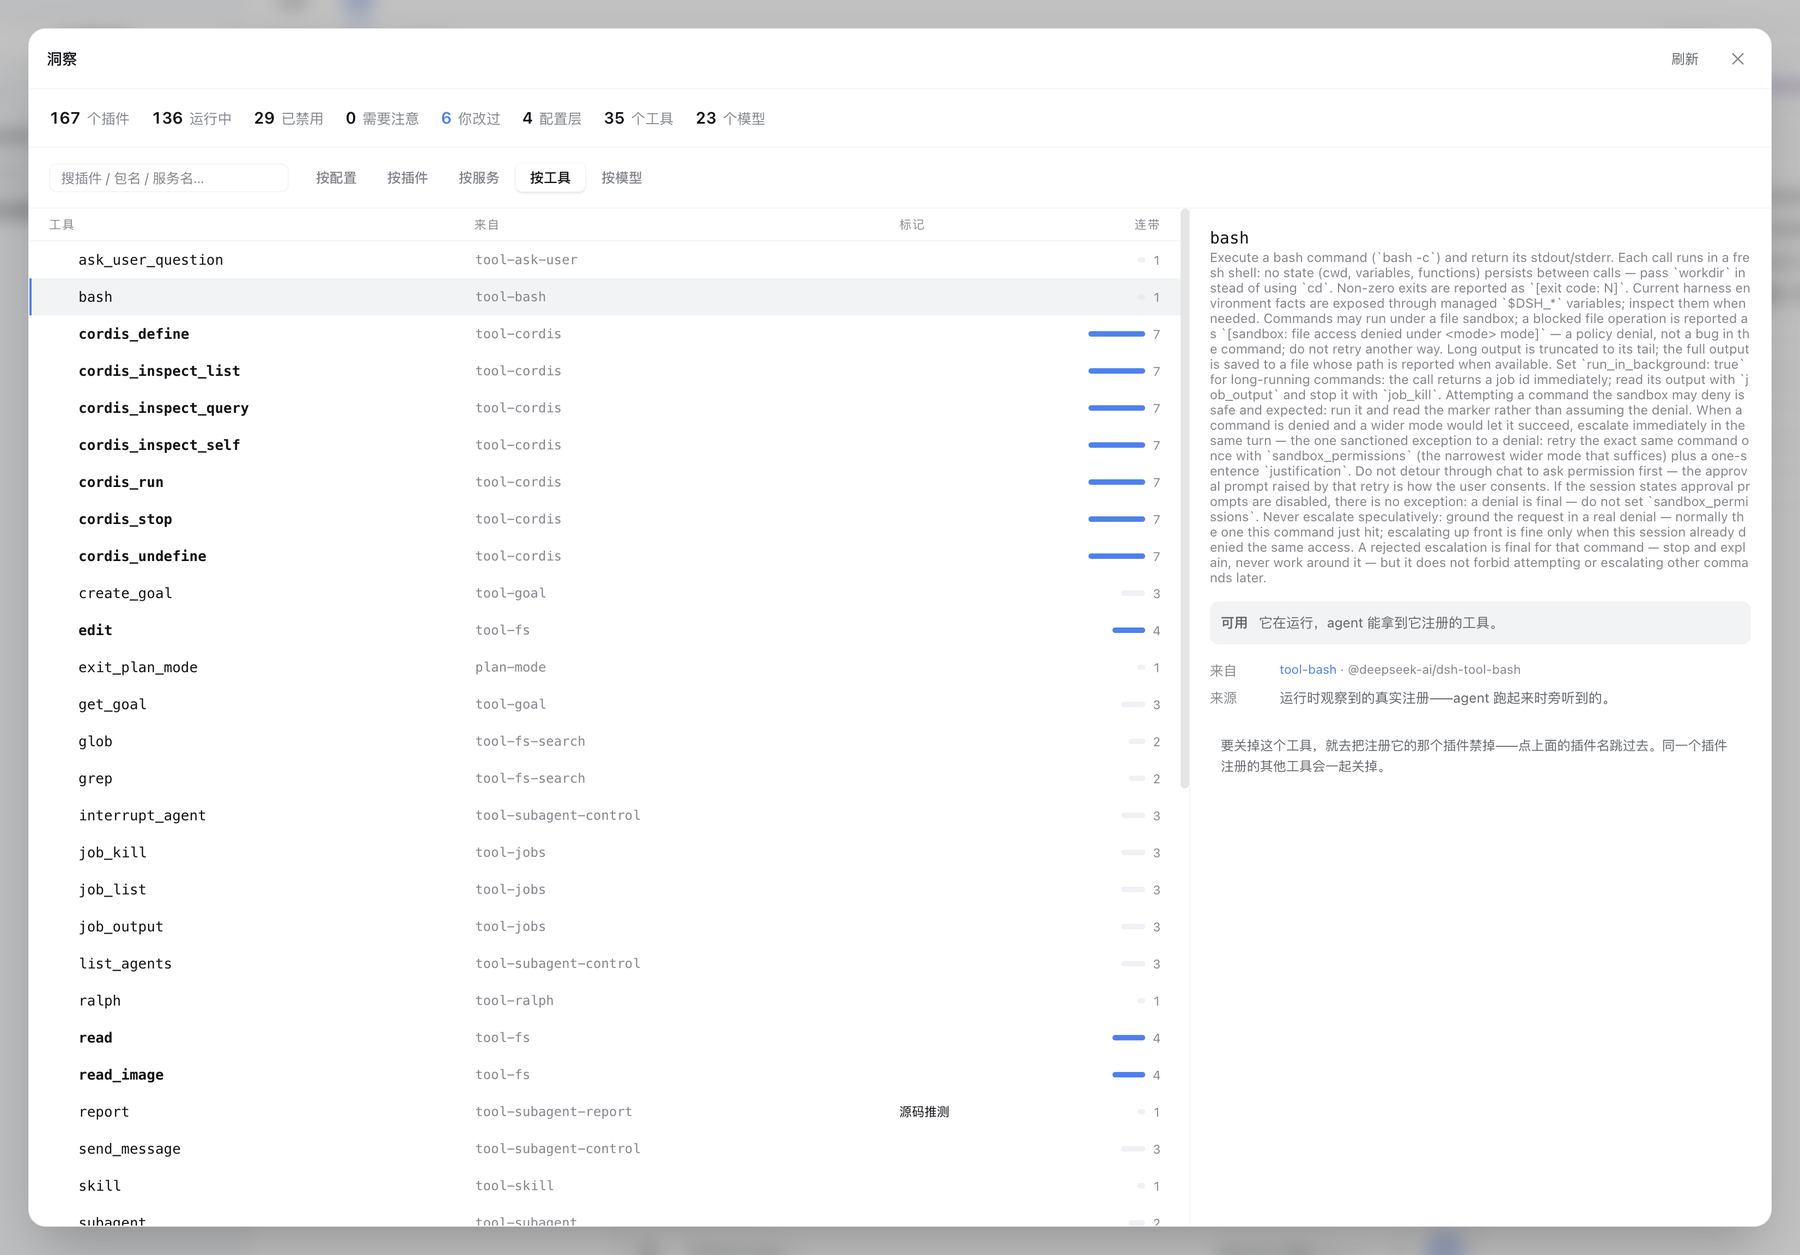
One row per tool name — bash, read, exit_plan_mode — not per plugin. Each one carries the package that registered it, its description, and how many sibling tools would disappear with it, because turning a tool off means disabling the plugin that registers it.
Upstream records no registrant on a tool definition, and tools are not registered until an agent is constructed. So this axis is assembled two ways and says which one it used: observed at runtime (the panel listens in as registration happens and attributes it by call stack) or inferred from source (a scan of the plugin's build output, marked as such — it can miss a name computed at runtime). A request is open upstream for the field that would make the second path unnecessary.
按模型 · By model — every model and how it got here
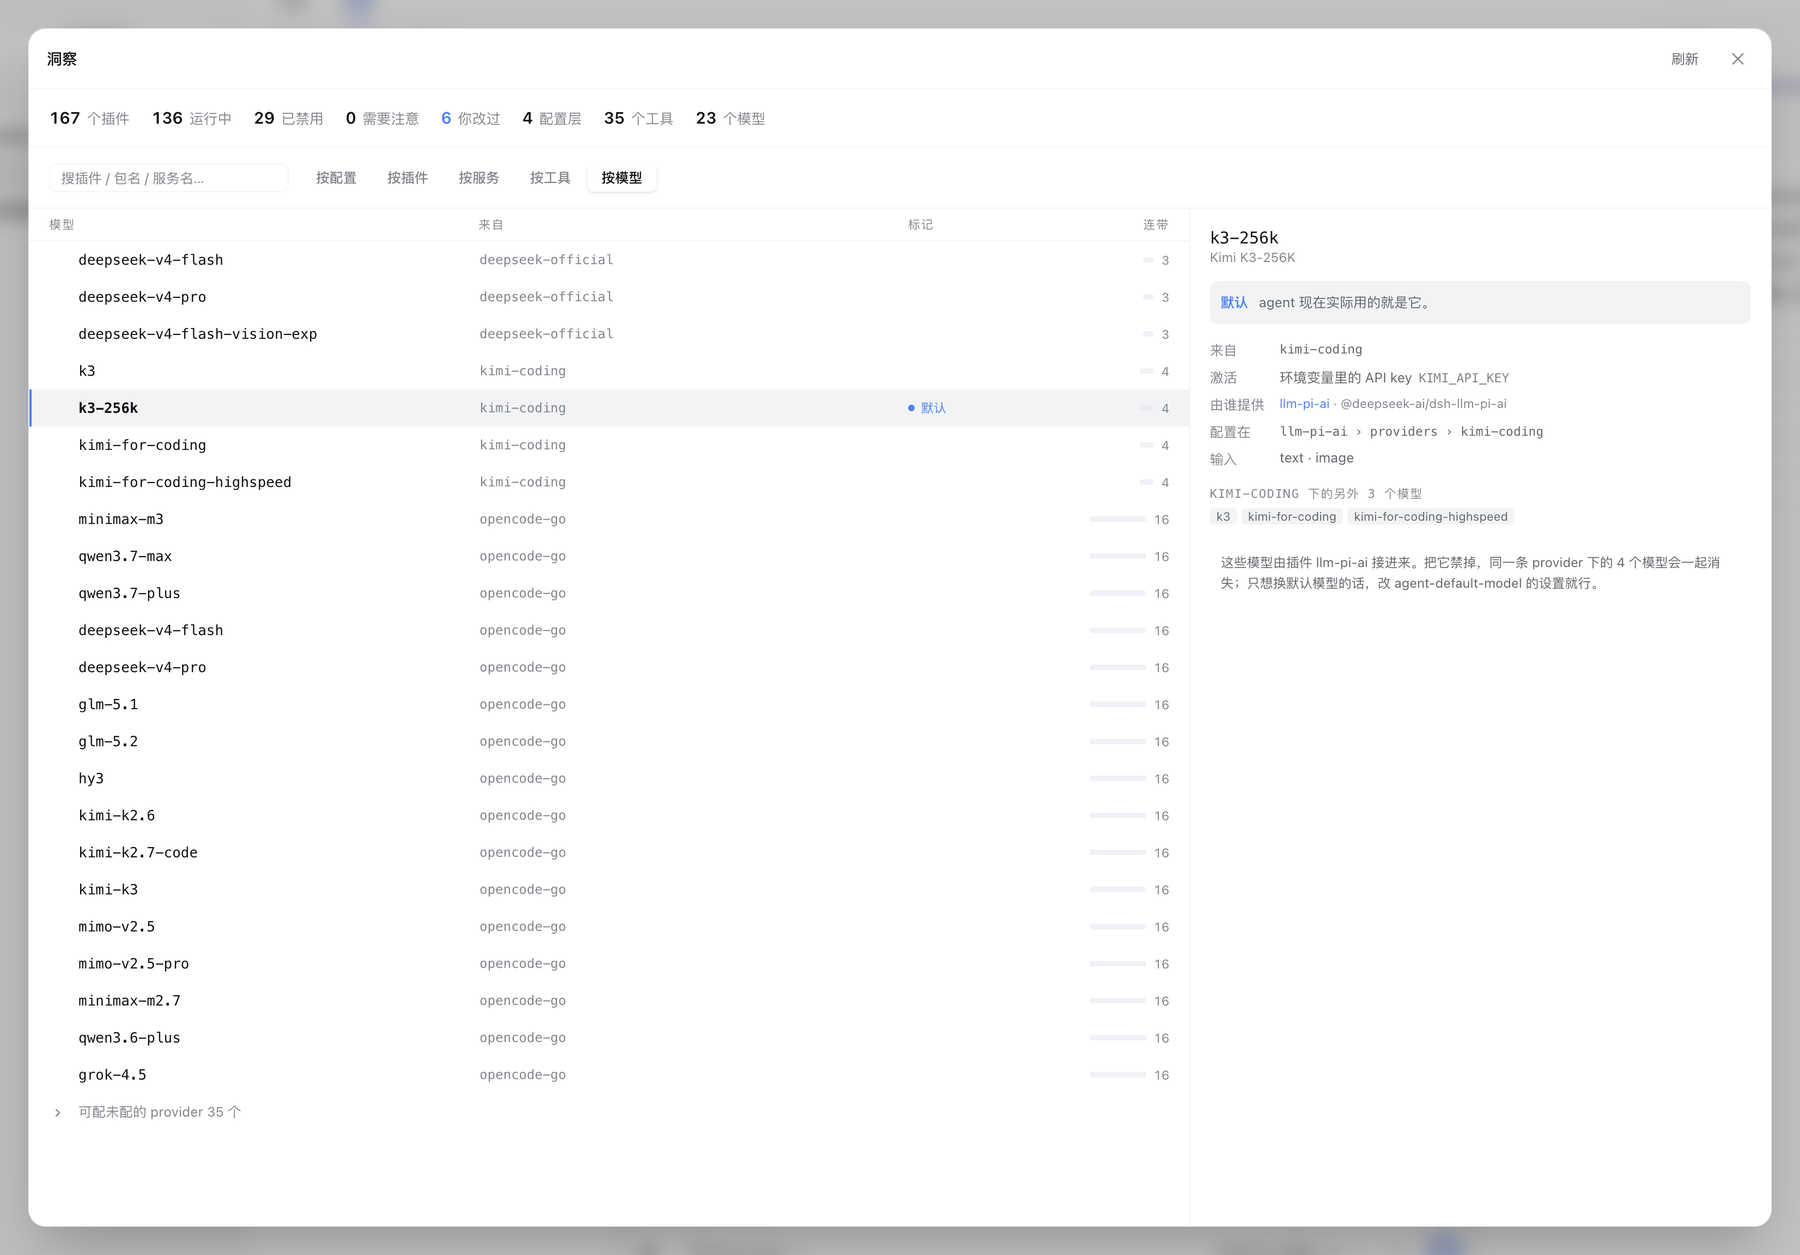
One row per model, with the provider route it belongs to and the plugin that brought that route in. The detail pane names the exact settings path its configuration lives at, and how the route is activated — an API key from an environment variable, a stored API key, or an OAuth grant. Provider routes that upstream declares as configurable but you have not set up are folded away at the end.
Nothing here touches the network: the panel reads the llm service's own read-only faces, never the model-discovery endpoint that would call your providers.
按预设 · By preset — who handed the session its toolkit
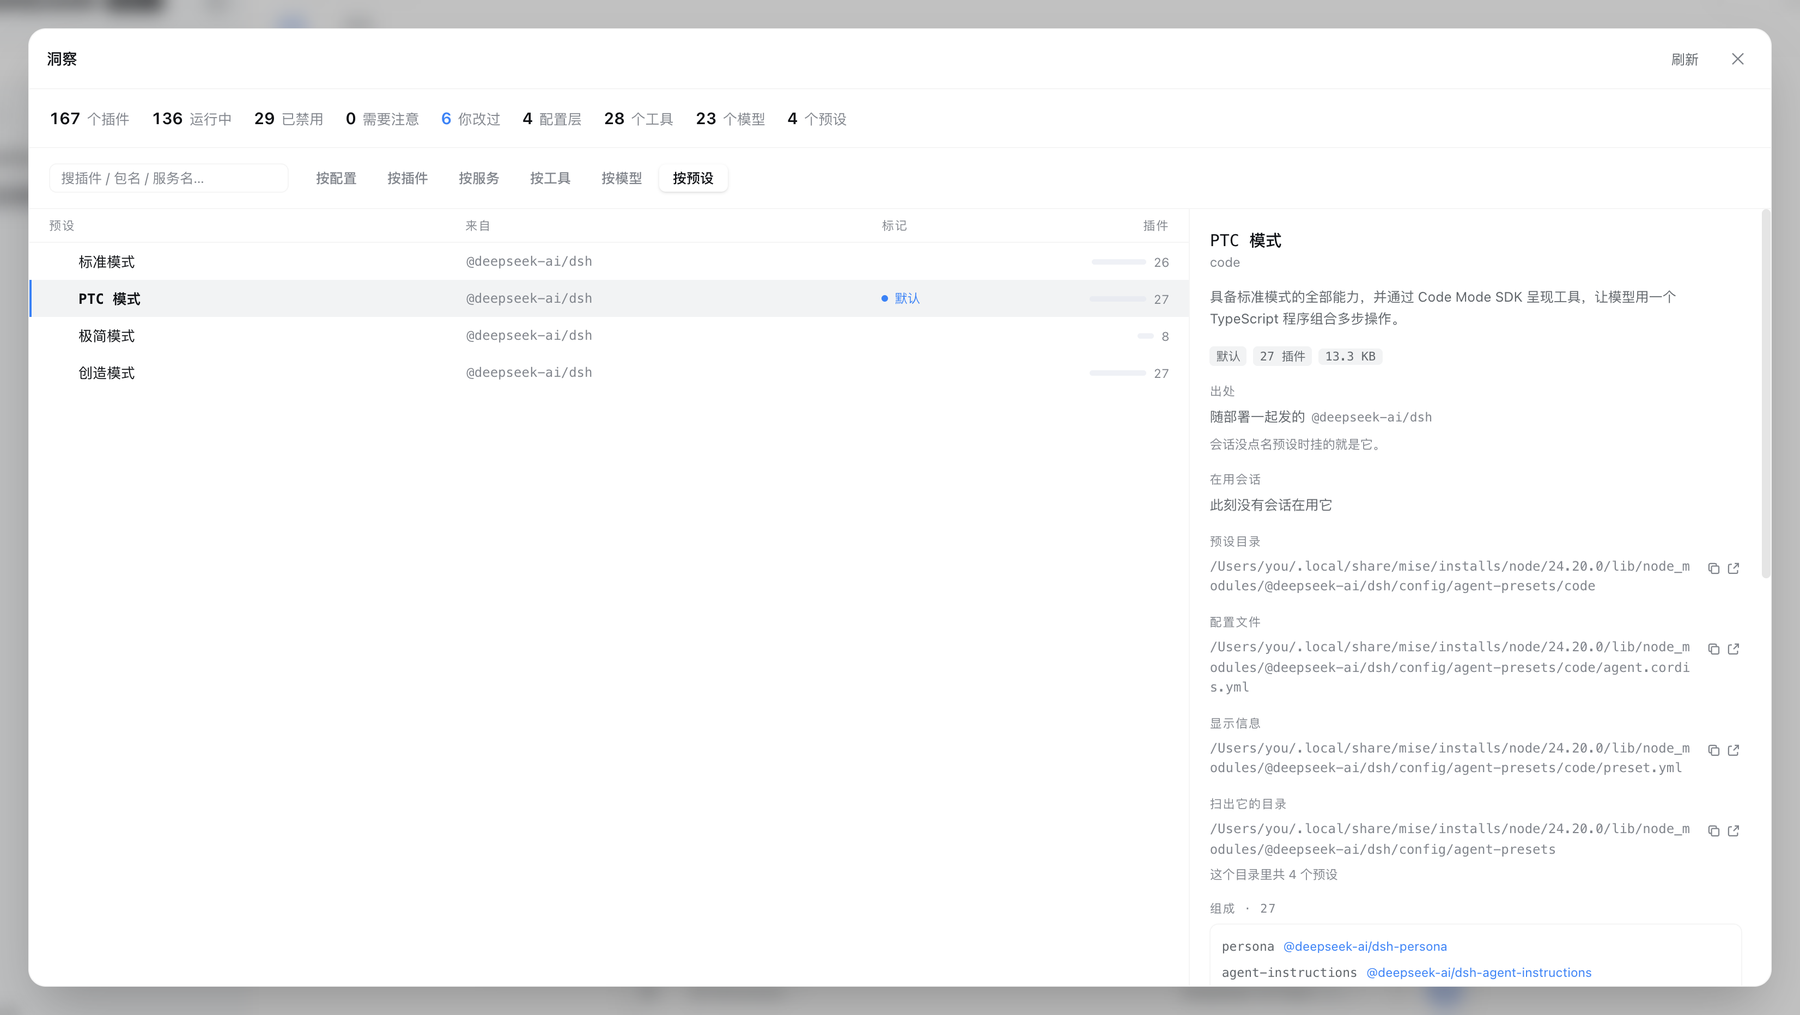
A preset is one agent-plane plugin composition. A session picks one when it starts, and that decides which tools it holds and which prompt sections it sees. One row per preset, answering four things:
- How many, which is the default, and how many sessions are on it right now. Usage follows upstream's
resolveSessionPresetrule: the creation header names the starting preset, every later switch is a logged event, and the last one wins — reading the header alone would count a switched session under the preset it was created with. When live session data is unavailable the panel says so rather than reporting "nobody". - Shipped / third-party / local. Upstream records only
system(shipped with the deployment) anduser(authored locally), which cannot separate "brought in by a third-party plugin". This axis classifies again by where the root directory sits on disk — the same rule every other axis uses — and names which package supplied it. A locally authored preset carries the same trust as shell access: it decides what tools the model holds. - What the configuration actually is. The composition (
agent.cordis.yml) is listed row by row: private realms on container rows, explicitly disabled rows, and rows whose switch is a!!jsexpression are all marked. Expressions are never evaluated: the panel knows an expression exists and refuses to claim the row is on or off. Both files open for reading. - They are not the plugins in the host tree. A preset is mounted only when a session starts, so its rows never appear on the By plugin axis — the detail pane says so, rather than letting you assume something went missing.
A broken preset stays on the roster with its reason: hiding it would leave its directory occupying the id with nothing to see or delete.
点界面查插件 · Point at the UI, name the plugin
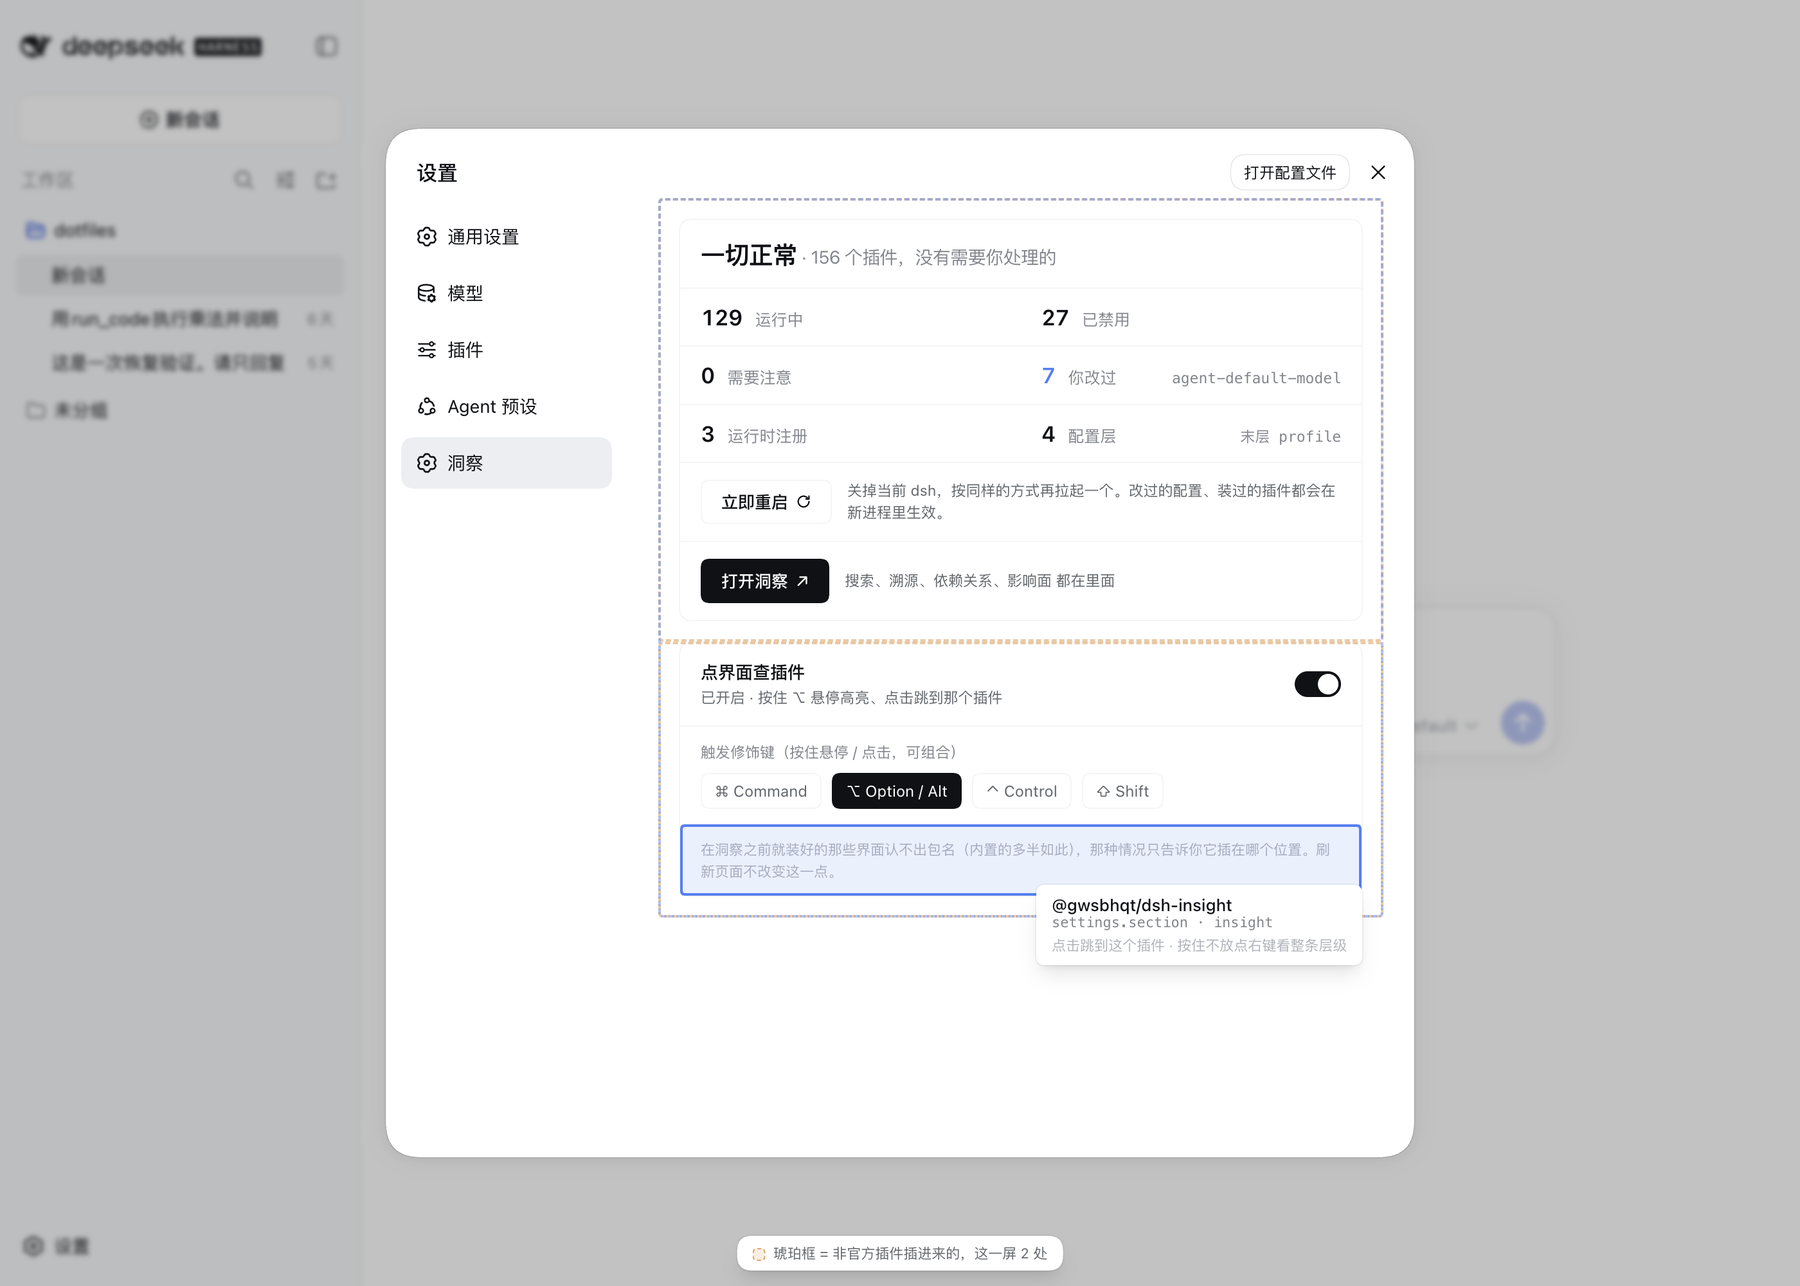
The switch lives in the Insight section of Settings. Once on, hold the modifier (⌥ by default, any combination works):
- Hover — highlights the UI under the cursor and names the plugin that contributed it, plus where it sits (the slot key and that cell's key). The dashed outline around it is that entry's whole territory.
- Click — opens the workbench straight onto the By plugin axis with that row selected, so the right column is its full dossier: where it came from, its wiring, its blast radius, its settings, and how the config stacked up.
- Right-click while holding — expands the entire
here → rootchain, from the innermost piece of UI out to the shell; pick any level to jump to the plugin that filled it.
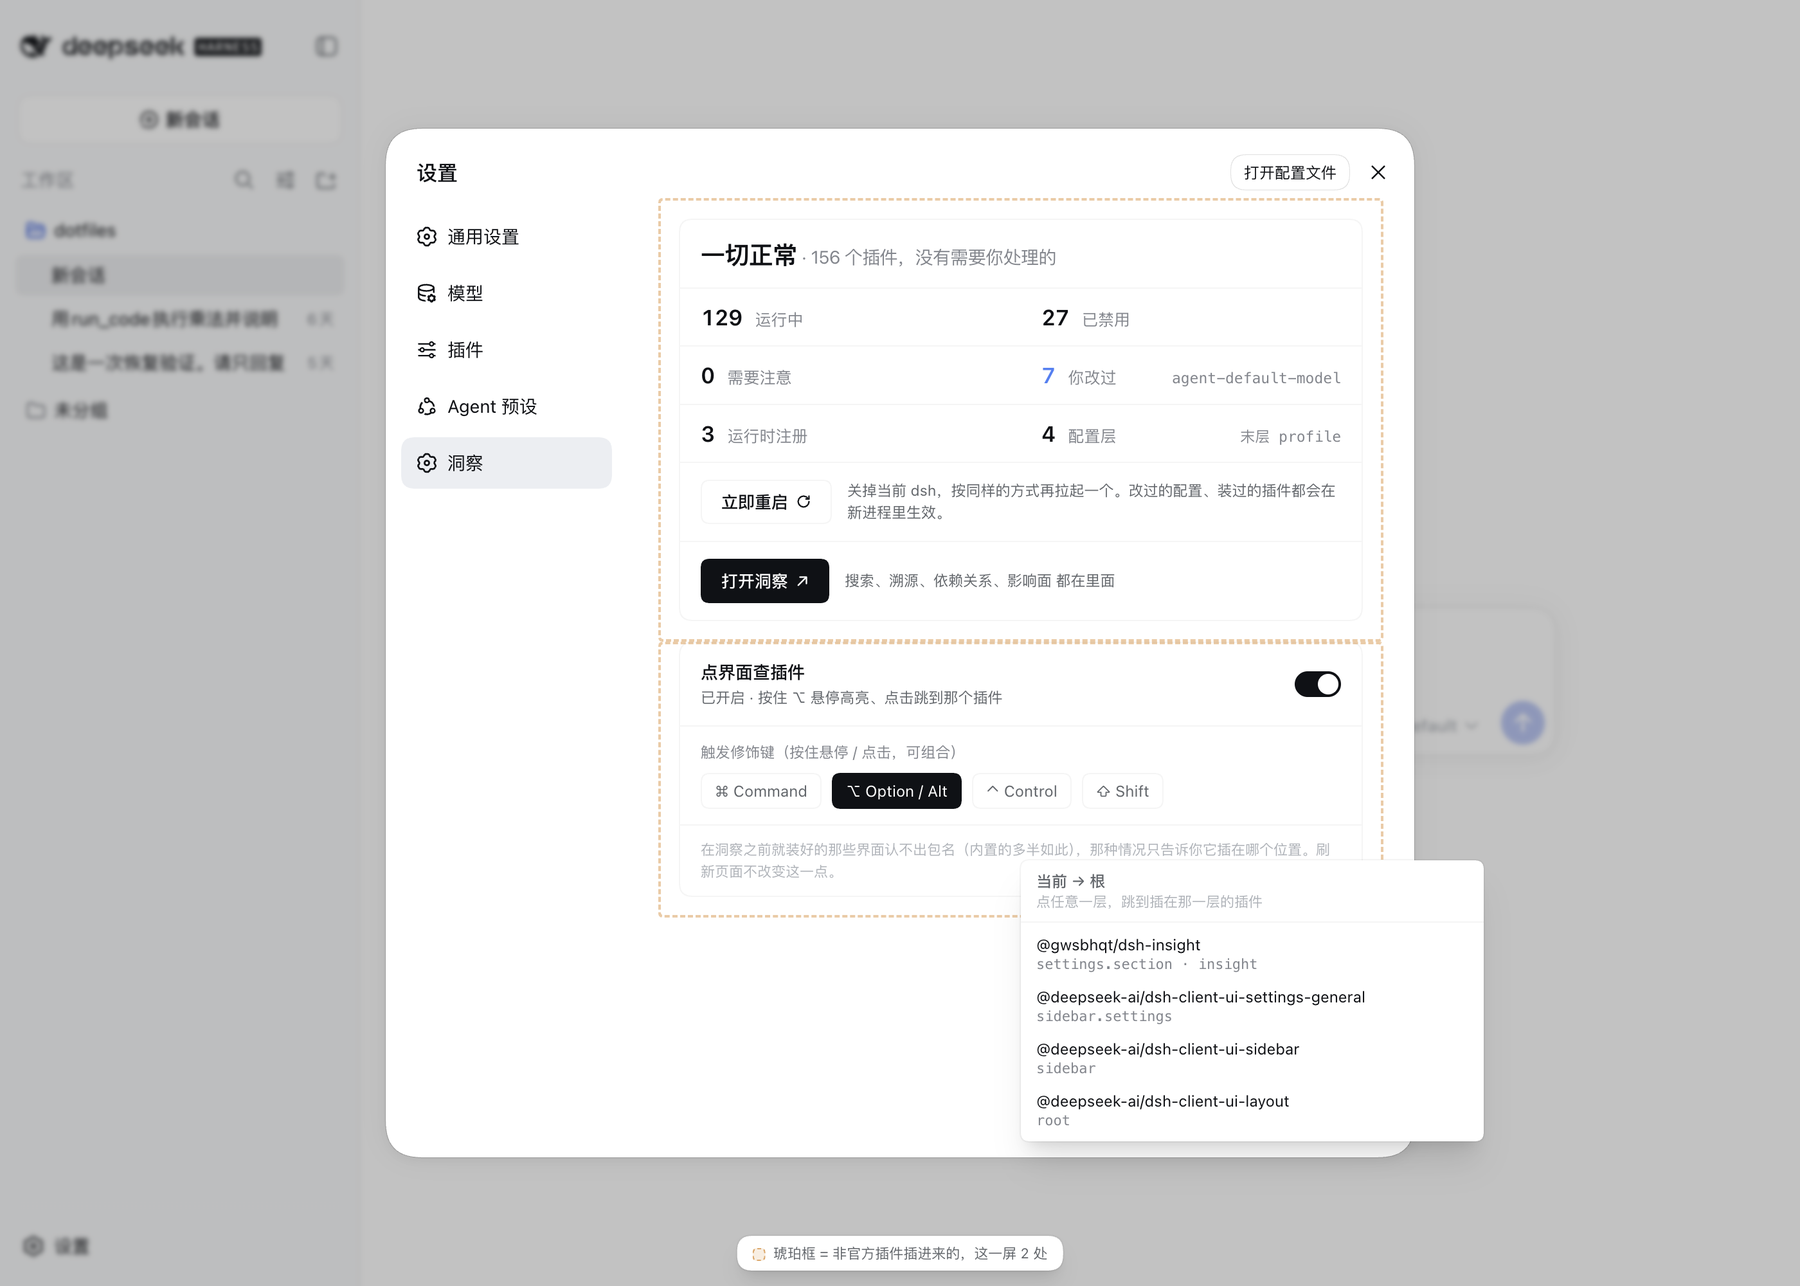
The moment you hold it, every piece of UI on this screen contributed by a non-official plugin is outlined in amber — third-party and local (your own packages linked in) alike. The test is the same one the By plugin axis uses: a resolved path outside node_modules means local, the @deepseek-ai scope means official, everything else is third-party — no allowlist anywhere. So "what on this screen did not ship with dsh" is one glance rather than a hunt.
Only what is genuinely visible gets marked: off-screen, self-hidden (visibility: hidden, transparent), and fully covered elements (the ones behind the settings dialog, rows scrolled out of their container) are skipped — otherwise the screen fills with outlines over nothing. The two colors have fixed jobs: amber means this did not ship with dsh, blue means you are pointing at this. Sharing one color would waste both.
How it knows: every piece of UI in the dsh web client is a plugin registering into a slot. Each slot outlet leaves a data-slot anchor in the DOM, and on the React tree every entry is wrapped by its own registration record. Attribution walks that chain upward from whatever the cursor hit.
When it cannot tell, it says so. The registrant name carried in the registration record is a minified class name in production builds, and those collide across packages — on a live client, dsh-api-gateway, ui-open-in-app, api-workspace-files and client-modules all report Z8. So the package name is never derived from it; it is taken from the registrant at the moment registration happens. Anything registered before Insight loaded cannot be named, and those levels report only where they sit rather than guessing from a minified name. In practice almost all of the page resolves: slot registration usually waits for the parent to declare the seat, so it actually lands during the first render — after every plugin has loaded.
Why it refuses to guess
Most of the work in this plugin is in the cases where the honest answer is "I don't know", and saying so instead of showing a plausible number:
- Ambiguous short ids get no attribution. The same short id can exist in two realms (
include:tool-bashandinclude:agent-presets:tool-bash). When a short id is not unique on both sides, the layer that inserted it is left blank rather than guessed. - Unevaluated expressions are not treated as
false.!!jsexpressions in config survive replay as an opaque marker; they are excluded from the drift report instead of being coerced to a boolean. Coercing them produced 22 false "this plugin was disabled" reports before this was fixed. - Multiple candidate providers stay multiple. When two plugins provide the same service name, the panel lists both instead of drawing a confident edge to one.
- Inferred data is labeled. A tool name extracted from build output is marked
inferred; one observed at registration is not. - Settings with no plugin say so. A settings namespace whose owner cannot be identified is labeled as a settings namespace, not shown as a plugin with a blank package.
- Version skew degrades, it does not break. When the host process is older than the browser bundle (a rebuild without a restart), the summary is recomputed in the browser and says so, and an axis whose endpoint the host does not know yet stays empty with an explanation instead of turning the panel red.
Read-only by design
- The panel has exactly one write path: the Disable / Enable action on the By plugin axis. There is no other edit surface, and that one path is fenced:
- It writes one file only — your profile patch layer (
$DSH_HOME/profiles/<name>/cordis.patch.yml) — and the target must resolve inside$DSH_HOMEand outsidenode_modules. Bundle layers belong to the package manager and the home layer is shared across profiles; neither is touched. - It edits text line by line and never re-serializes the YAML. Round-tripping through a YAML library produces valid syntax and erases every comment you wrote — and those comments are the only record of why something was turned off. Only the one line that must change is touched; a newly appended entry carries a comment saying which tool added it.
- It takes two clicks, with the confirm state in red, reverting on its own after 2 seconds.
- The button flips with the configuration, and taking effect is said separately: the patch layer is hot-reloaded, but whether this particular entry reaches the running process is dsh's call. The button reflects the line you just wrote (click again to withdraw it) while the row is marked needs restart — neither pretending it already took effect nor looking like nothing was written.
- An ambiguous short id is refused: a patch targets by id, and when the same short id exists twice at runtime the write would hit both — the panel does not guess. An id that does not exist at runtime is refused too, rather than leaving a patch that can never match.
- The write is atomic: a temp file in the same directory, then a rename.
- The result is parsed before it is written; if it does not read back, nothing is written. A broken patch layer does not cost you one failed toggle — it stops the next dsh start in recovery mode. The bar is the loader's own: the top level must be a list, so withdrawing the last entry leaves
[]behind rather than a file of bare comments. A file that already fails to parse, or one written in[…]flow style that line-by-line editing cannot reach, is refused with the reason spelled out instead of being written over.
- It writes one file only — your profile patch layer (
- Credential bodies are never read.
.credentials.yamlis listed for its path and size and is excluded from the preview allowlist. Activation methods are read through the credential service's enumeration face, whose contract is "every stored record, values excluded" — the panel learns that a record is an API key or an OAuth grant, never what it contains. - File preview is allowlisted.
files/readandfiles/openaccept only paths the host itself discovered, validated after resolution. - Only two actions leave the browser, and both take your click:
- Open in editor, on an allowlisted config file or plugin directory.
- Restart now — stop this dsh and start it again exactly the way it was launched (no file is touched; only the process changes). It takes two clicks; it is disabled while any session is running; and it defaults to off when systemd is detected, because restarts belong to the supervisor there.
DSH_INSIGHT_ALLOW_RESTART=0turns it off for good,=1forces it on. Inside an Electron app (an Electron desktop app) it is always off and=1does not override it: there the host is the app's own process, so the final SIGTERM would shut the whole app down — use the app's own restart. The button depends on no other plugin. It sits both on the summary card and in the workbench header — the toggles live in the workbench, and the workbench covers the page, so the card's copy would be out of reach — sharing one state and one set of guards.
- The tool observer wraps
tools.registerin memory only. It writes no files, and touches neithernode_modulesnor the harness installation. - Point-at-the-UI does two things at runtime, both in the browser, neither touching a file or any dsh artifact:
- Wraps the slots service's
registerto record which package contributed which piece of UI. The original method runs untouched; one WeakMap write happens after it. The patch is owned by the plugin's lifecycle and unwinds on unload — the same shape as the tool observer. - Reads React's internal fiber fields to reach that registration record. Read-only, the way DevTools does it. When it cannot read them, it falls back to reporting the slot alone.
- Swallows that one click while the modifier is held, so exploring never lands a real action on the page. Because it changes how the page feels, the switch ships off; release the modifier and everything behaves normally.
- Wraps the slots service's
Development
pnpm install
pnpm check          # typecheck + build + 208 tests

dsh plugin --profile <name> add /path/to/dsh-insight   # install the working copy
dsh --profile <name>
pnpm watch rebuilds on change; the harness picks up the new bundle on page reload.